Struggling to choose between Power BI and Tableau for your data visualization needs? With the overwhelming number of business intelligence tools out there, you can’t rely on superficial opinions. This article uses real data to show which one truly helps you analyze your data effectively—based on your budget, skill level, and strategic goals. Ready to turn data chaos into winning decisions?

Power BI and Tableau dominate the data visualization market, helping users analyze complex data through interactive visuals. Learn why Business Intelligence matters when structuring your analytics projects. Power BI, a Microsoft product, integrates seamlessly with the Azure ecosystem, while Tableau stands out for its flexibility across diverse environments.
Both business intelligence tools connect to multiple data sources, create interactive dashboards, and share insights. Power BI focuses on accessibility for business teams, while Tableau shines with its advanced visualizations. Analyzing data becomes intuitive thanks to their modern interfaces and real-time processing capabilities.
Power BI stands out with its intuitive interface, similar to Excel. Both beginners and experts can easily create reports with drag-and-drop features. Integration with Microsoft 365, Teams, and SharePoint makes collaboration easy. The free Power BI Desktop enables quick learning with guides and instructional videos. Its interface adapts to all devices.
Tableau also uses a drag-and-drop model. Its VizQL technology turns actions into complex queries. The interface is suitable for beginners and experts alike. Professionals appreciate its advanced capabilities. The Tableau Community brings together over one million passionate and engaged members worldwide (source: official Tableau website).
| Feature | Power BI | Tableau |
|---|---|---|
| Approach | Excel-like interface, easy to use | Drag-and-drop based with VizQL technology |
| Beginner-friendly | Instant access to data sources and reports | Intuitive UI but steeper learning curve |
| Collaborative design | Native integration with Microsoft ecosystem | Sharing via Tableau Server or Tableau Public |
| Advanced customization | Limited options compared to Tableau | High flexibility for complex visualizations |
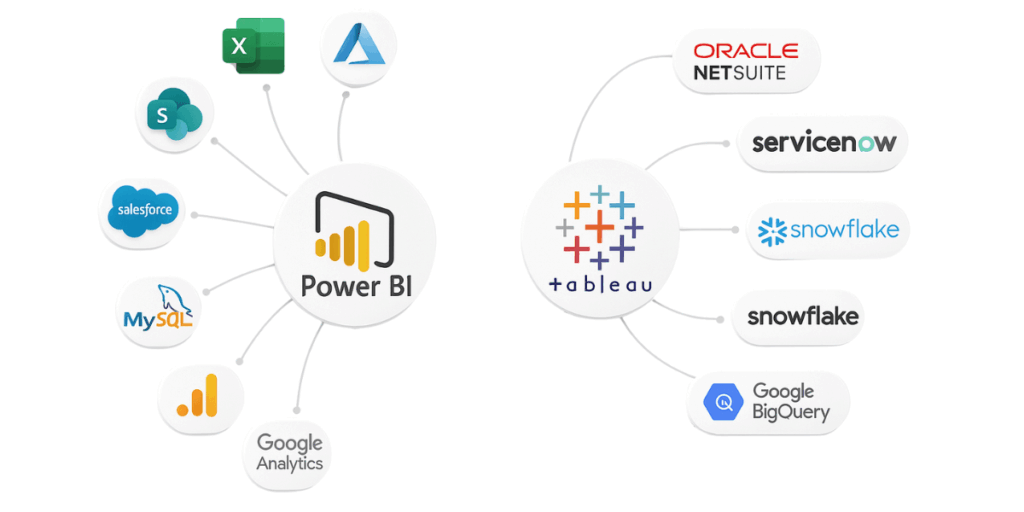
Power BI natively integrates with the Microsoft ecosystem. Direct connections to Excel, SQL Server, and Azure make it easy to access existing data. Over 100 standard connectors let users import files and databases effortlessly. Synchronization with Microsoft Fabric simplifies the management of semantic models.
Power BI supports a wide range of external sources—from files (Excel, CSV, JSON) to databases (MySQL, PostgreSQL), and cloud services (Salesforce, Google Analytics). Access to SharePoint folders and SharePoint Online lists extends capabilities. Connections to platforms like Snowflake or SAP HANA enhance the data visualization offering.
Here are the main data sources supported by both tools:
Power BI optimizes queries using an in-memory compressed cache, but has a default 1 GB limit. The Azure ecosystem boosts performance via Fabric to overcome this constraint. Tableau handles petabytes of real-time data without size restrictions. Large enterprises often prefer Tableau for its scalability with massive datasets.
Tableau transforms queries into a visual language using VizQL, speeding up the analysis of both cloud-based and on-premises data. Power BI delivers solid performance on moderate data volumes. However, in highly complex or large-scale scenarios, advanced architectures like Tableau’s may offer more consistent performance.
Power BI is well suited for interactive and fast analyses with common datasets. Tableau may be preferred for more complex processing and visualization needs involving large data volumes, depending on the technical environment. Compare both tools based on your data volumes and real-time requirements to select the right business intelligence partner.
Power BI offers a free version (Power BI Desktop), along with Pro and Premium licenses. Small and medium businesses benefit from affordable pricing. The free version allows local report creation, but sharing requires a Pro or Premium license.
Companies pay more for advanced collaborative features. Creator licenses include dashboard publishing. Paid versions offer support for complex data management. Learn the essentials of dashboard creation in our Tableau Desktop training course.

Power BI offers standardized but effective visualizations. Bar, line, map, and gauge charts are built-in. You can customize colors, axes, and segments. Integration with R/Python expands possibilities. Interactive visuals allow cross-filtering of data.
Tableau stands out for its highly customizable visualization options. Its unconventional chart types (such as waterfall and Pareto) are well-suited to specific analytical needs. The specialized visual library available through Tableau Exchange further expands the possibilities. Many advanced users choose Tableau for its 3D and stacked modeling capabilities. Its maximum flexibility makes it a top choice for demanding data analysts.
Power BI and Tableau differ when it comes to creativity. Tableau allows more flexibility for rare formats (bump charts, waterfall charts). Export options vary too. Power BI to Excel/.csv, Tableau to PDF/PPT. Your choice between speed and precision!

The Power BI community, managed by Microsoft, is particularly active on official forums such as the Microsoft Fabric Community, where thousands of technical discussions are exchanged daily.
Users have access to comprehensive documentation, tutorials, and free learning resources, notably through Microsoft Learn. Microsoft experts and certified members regularly share best practices and enrich the ecosystem with practical solutions.
Tableau fosters a vibrant community through its Tableau User Groups (TUGs), local or virtual groups that promote peer exchange on real-world use cases, technical challenges, and projects (source). The annual Tableau Conference brings together thousands of participants for expert sessions, hands-on workshops, and customer success stories.
In addition, Tableau’s academic programs have helped over one million students and instructors gain free training in data analytics (source). Lastly, Tableau Ambassadors, recognized for their expertise, support new users and foster engagement within the global community (source).

Power BI uses Power Query to clean, transform, and model data. From Excel files to cloud databases, its drag-and-drop interface simplifies processing. Rules apply automatically in the background, with M language available for advanced users.
Tableau Prep, a dedicated tool, is separated from the main product. Its two components (Builder and Conductor) make cleaning and scheduling easier. Despite a 1 GB limit, its visual logic appeals to experienced users.
Power BI relies on DAX for complex calculations, while Tableau uses more intuitive expressions. DAX, similar to Excel, enables dynamic measures, while Tableau embeds calculations directly into the data flow. Both tools suit businesses, but differ in technical approach. Your choice depends on your business culture and modeling needs.

Between Power BI (Microsoft integration and affordability) and Tableau (flexibility and advanced visuals), your choice depends on your data visualization needs, infrastructure, and resources. If you’re aiming for fast adoption and a limited budget, go with Power BI. For ultra-customized dashboards, Tableau is king. Whatever you choose, mastering these tools will boost your analytics and business intelligence in 2025!
| Criteria | Power BI | Tableau |
|---|---|---|
| Ease of use | Intuitive interface similar to Excel, quick to learn | Powerful drag-and-drop, but steeper learning curve |
| Data connectors | Excellent Microsoft integration (Excel, Azure, SharePoint, etc.) | Wide range of connectors, including specialized ones via Tableau Exchange |
| Performance & scalability | Great for medium data volumes, 1 GB default limit | Excellent scalability for large volumes and real-time |
| Cost & licensing | Free version (Desktop), affordable Pro/Premium for SMBs | Higher cost, Creator/Explorer model better suited for larger organizations |
| Visual customization | Effective standard visuals, customizable via R/Python | Ultra-flexible, wide chart variety, ideal for analysts |
| Community & support | Very active Microsoft community, lots of free resources | Engaged community, dedicated events, strong certified support |
| Modeling & preparation | Power Query and DAX (Excel-like), ideal for business users | Tableau Prep and embedded calculations, more visual, powerful for analysts |
| Best suited for… | Beginners, SMBs, Microsoft ecosystem, fast deployment | Advanced analysts, large companies, complex projects, rich visualization |
What are the ideal use cases for Power BI?
Power BI is perfect for businesses that want to leverage their data for better decision-making. It helps track real-time KPIs, detect anomalies, and easily visualize performance. Ideal for teams that need clear, interactive dashboards connected to multiple data sources.
What are the ideal use cases for Tableau?
Tableau is powerful for analyzing and visualizing complex data. It’s used in diverse fields like sales, marketing, finance, or HR. Its Dashboard Starters and ready-to-use templates save time. It’s a great tool for analysts who want to freely explore data and create advanced visualizations.
How to choose between Power BI and Tableau in 2025?
The choice depends on your context. Power BI is easier to learn, well integrated with Microsoft 365, and more budget-friendly. Tableau is more flexible and powerful, especially for large datasets, but requires more expertise. If you’re starting out or already use Microsoft tools, Power BI is often the right pick. For advanced visualization needs, Tableau may be a better fit.
Power BI or Tableau: which tool is best for beginners?
Power BI is recommended for beginners. Its interface is intuitive, especially if you’re familiar with Excel or Microsoft tools. You can quickly build reports and dashboards. Tableau offers more visualization possibilities, but requires more learning. If you’re willing to invest time, it can also be a great choice.